eCharts-Adapter für ioBroker
Erstellen Sie nützliche Diagramme in ioBroker:
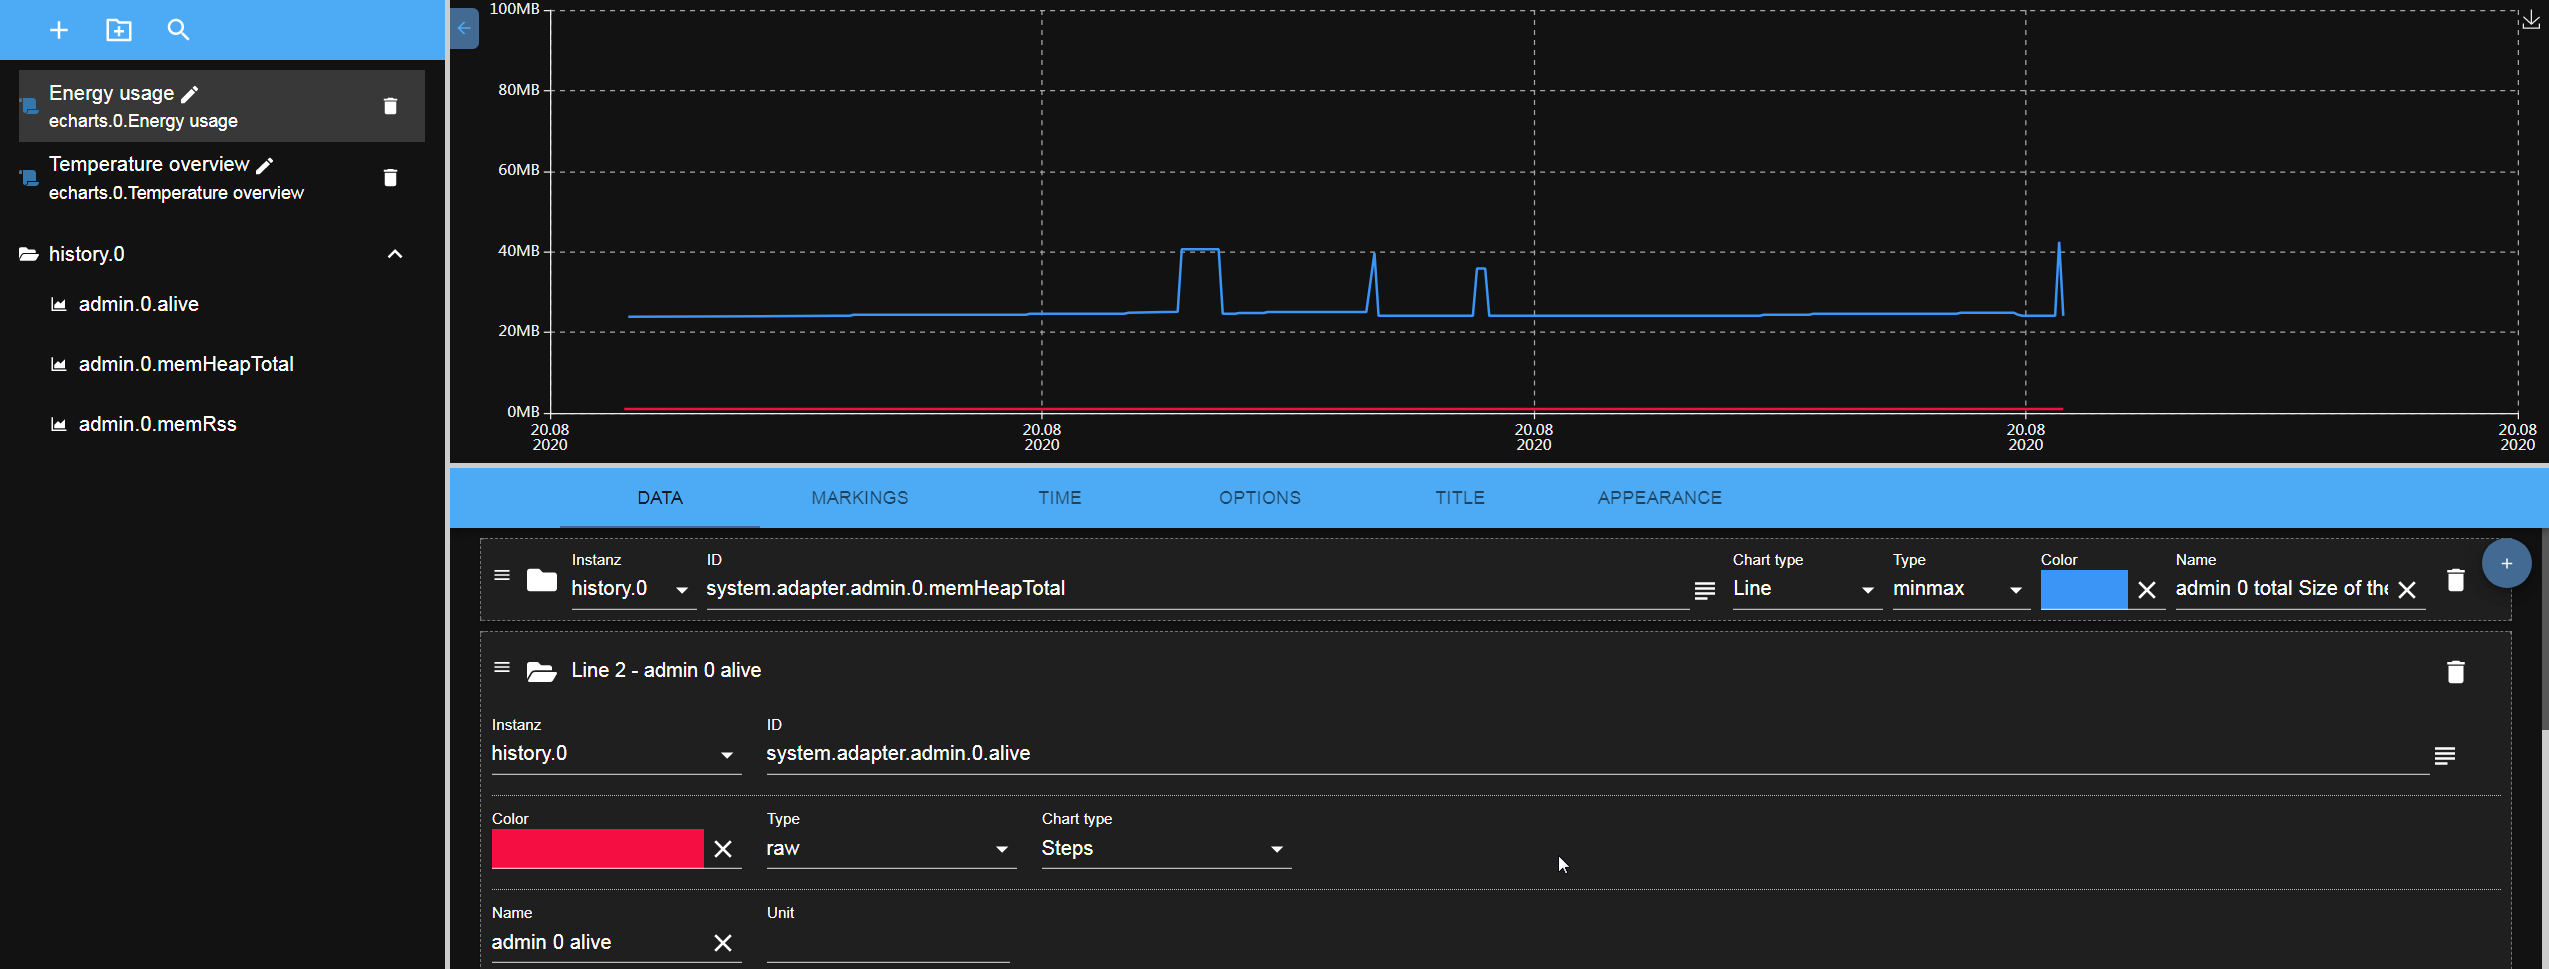
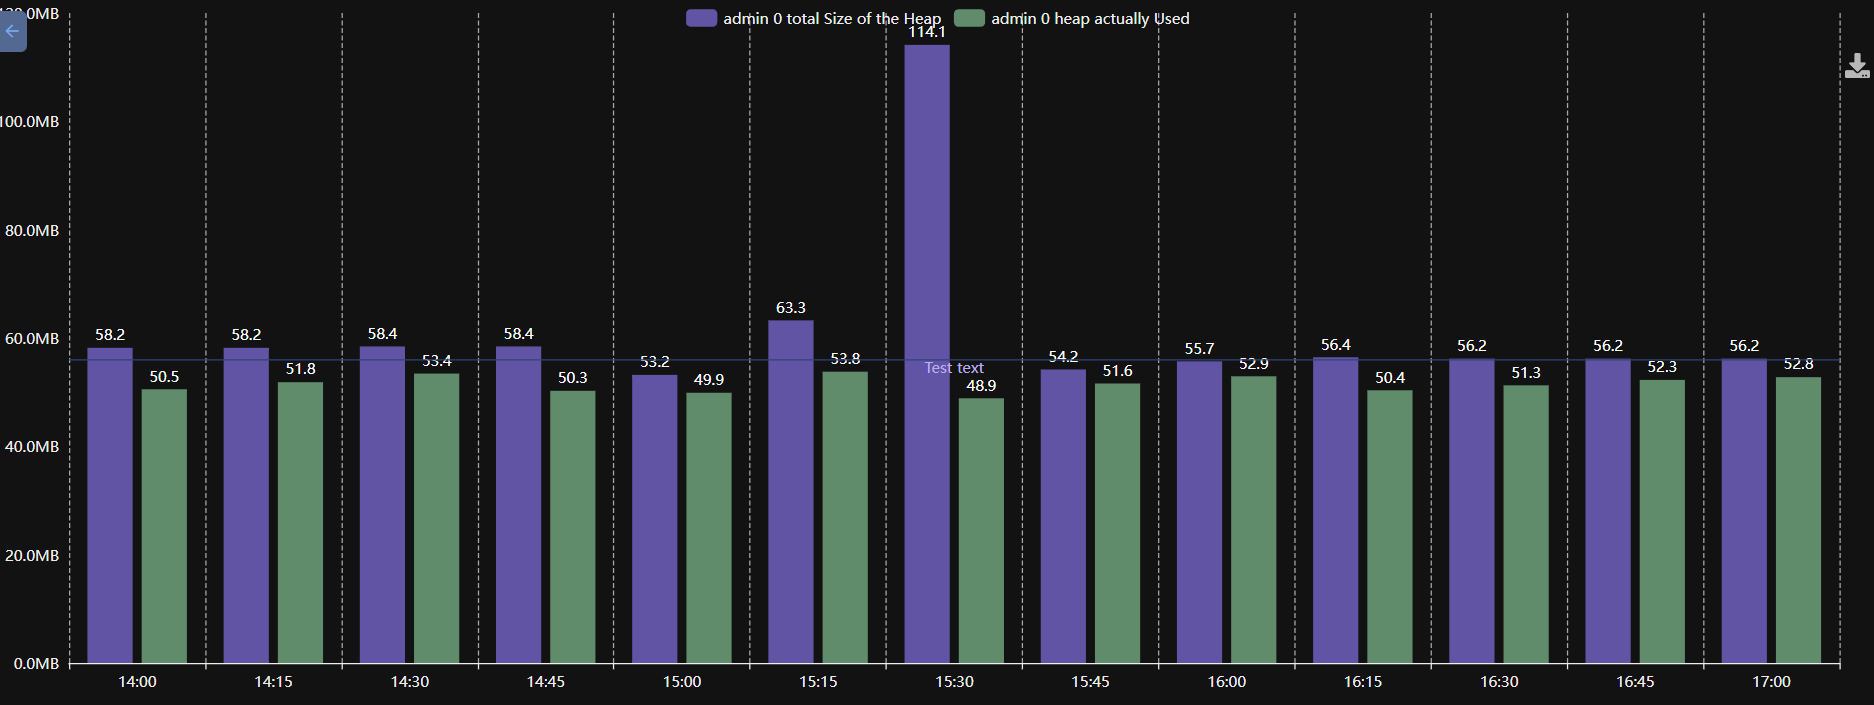
 Verwenden Sie die Aggregation „Tatsächlicher Wert“ für das prognostizierte Ergebnis.
Ein Balken pro Datenpunkt
Normalerweise stellt die X-Achse eines Balkendiagramms die Zeit dar, und jeder Balken repräsentiert ein Zeitintervall. Mit der Balkeneinstellung „Ein Balken pro Linie“ wird die X-Achse stattdessen zur Liste der Linien: Jede Linie erhält genau einen Balken, der den letzten Wert dieser Linie anzeigt. Zusammen mit der Aggregation „Aktueller Wert“ wird der aktuelle Wert jedes Zustands angezeigt, z. B. der Verbrauch jedes Geräts.
Horizontale Balken drehen das Diagramm um 90°, sodass die Namen auf der Y-Achse stehen. Das ist die bessere Wahl für lange Namen oder viele Zeilen.
Verwendung
Fügen Sie nach dem Neustart den Tab im Adminbereich hinzu: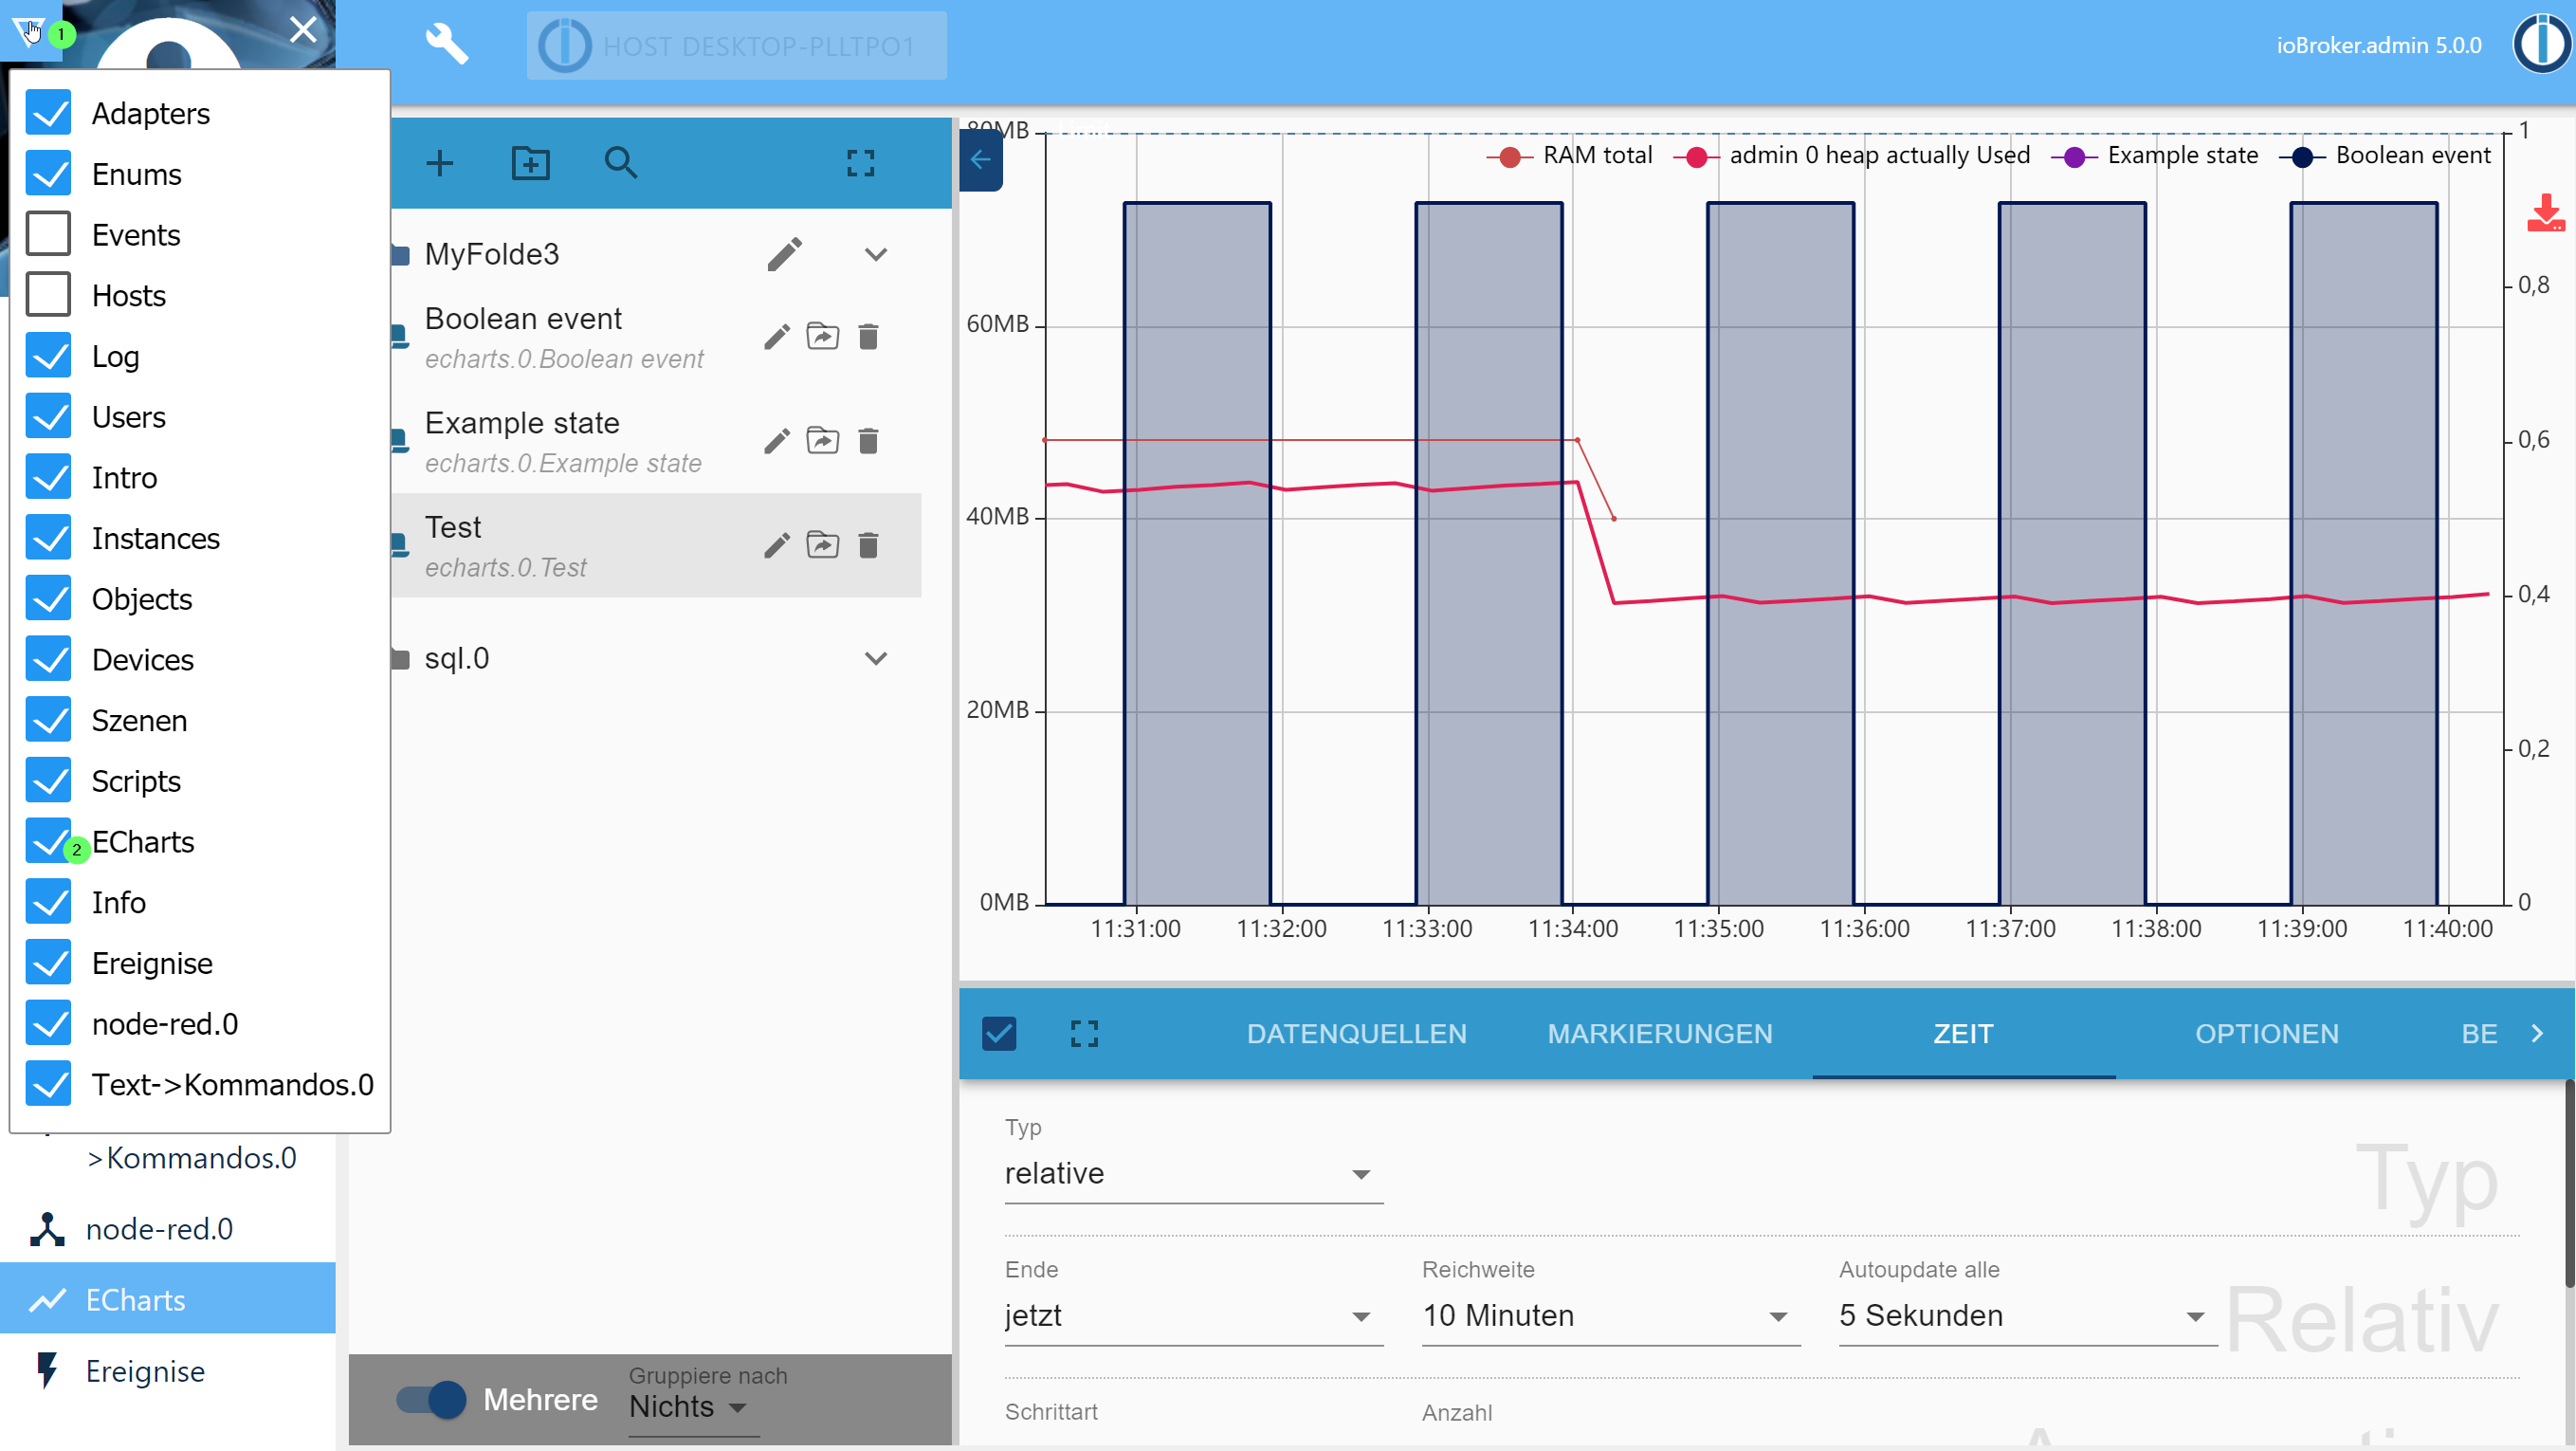
Die erstellte Voreinstellung kann auch im Webadapter aufgerufen werden. URL: http://IP:8082/echarts/index.html?preset=echarts.0.PRESETID Die
Für vis Es gibt ein spezielles Widget mit einfacher Auswahl von Voreinstellungen.
Zeitbereich-Widget
Neben dem Diagramm-Widget befindet sich das Widget „E-Charts-Zeitbereich“. Es zeigt dieselben drei Felder wie der Tab „Zeit“ des Preset-Editors – Typ (relativ oder statisch), Ende und Bereich – und überlässt die Auswahl dem Benutzer für die Diagramm-Widgets derselben Ansicht. Jedes der drei Felder kann in den Widget-Einstellungen deaktiviert werden; ein deaktiviertes Feld behält den Wert seines Attributs bei. Solange unter „Diagramme“ kein Diagramm ausgewählt ist, folgen alle E-Charts-Widgets der Ansicht dieser Auswahl.
Das Gleiche funktioniert auch ohne das Widget: Ein Diagramm, das mit einer Voreinstellung geöffnet wird, extrahiert den Bereich aus dem URL-Hash, z. B. http://IP:8082/echarts/index.html?preset=echarts.0.PRESETID#range=60&relativeEnd=now Die range, relativeEnd, timeType, start, start_time, end Und end_time werden dort gelesen und überschreiben die Ergebnisse der Voreinstellung, ohne die Voreinstellung selbst zu verändern.
Diagrammmodi
Der Reiter „Optionen“ des Preset-Editors öffnet sich mit einem „Diagrammmodus“, der anzeigt, wie das gesamte Diagramm aussieht:
- Gemischt – das Diagramm, wie es immer war: eine Zeitachse, und jede Linie hat ihren eigenen Typ.
- Donut -Diagramm – ein Ring, jede Zeile enthält ein Segment mit dem aktuellen Zustand. Größe des Lochs, Beschriftungen der Segmente, Text im Loch und Reihenfolge der Segmente werden daneben festgelegt. Die Werte werden per Abonnement aktualisiert, sodass das Diagramm den Zuständen ohne Neuladen folgt.
- Balken (aktueller Wert) – ein Balken pro Zeile anstatt eines Balkens pro Zeitintervall. Dies ist die Funktion des Kontrollkästchens „Ein Balken pro Zeile“; eine alte Voreinstellung wird als dieser Modus interpretiert und bleibt aktiv.
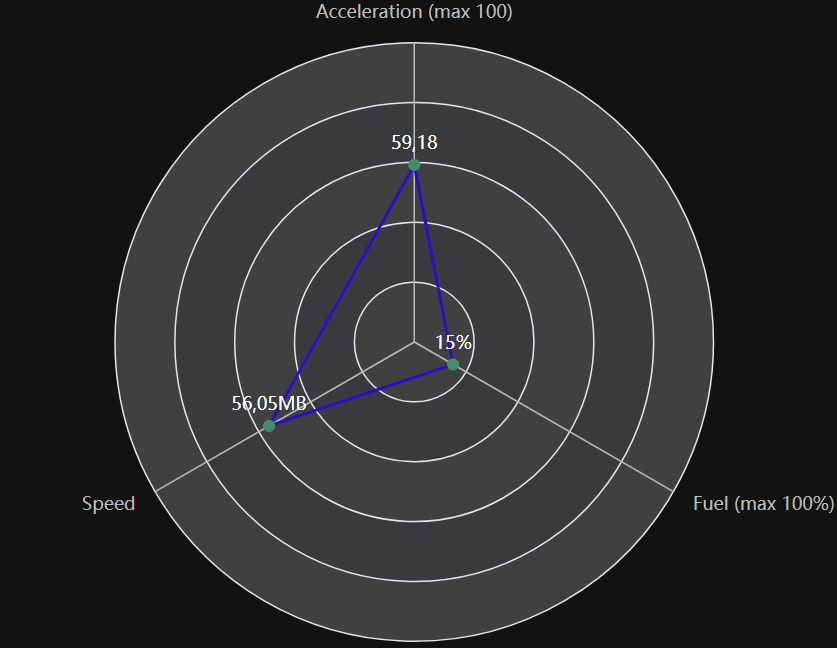
- Radar – die Polarkarte. Früher gab es einen Typ, den eine einzelne Linie annehmen konnte, wodurch dann alle anderen Linien entsprechend angepasst wurden; eine alte Voreinstellung wird als dieser Modus gelesen.
- Gauge - bei der Form "Circles" ist die Skala zu einem vollständigen Kreis gebogen und pro Zeile wird ein Ring übereinander gestapelt, wobei sich die Namen und die Werte in der Mitte befinden; bei der Form "Gauge" bleibt die Skala offen und jede Zeile erhält einen Zeiger, wobei sich die Namen und die Werte in einer Zeile darunter befinden.
Donut und "Bar (aktueller Wert)" lesen die Zustände und niemals die Historie, daher benötigen sie keinen Zeitbereich und keine Aggregation.
Diagramm ohne iFrame (experimentell)
Das vis-2-Diagramm-Widget zeichnet das Diagramm in einem iFrame: Jedes Diagramm in einer Ansicht bringt seine eigene React-Anwendung, seine eigenen ECharts und vor allem seine eigene Socket-Verbindung mit. Das Attribut „Without iframe“ zeichnet es stattdessen im Widget – das Modell verwendet dann die bereits von der vis-Laufzeitumgebung bereitgestellte Verbindung, und das Diagramm wird im vis-2-Theme angezeigt.
Das Widget für ioBroker.devices verwendet dieselben Einstellungen. Beide betten ein ChartEmbed von src-chart, was die einzige Stelle ist, die das Diagrammmodell mit der Diagrammansicht verbindet.
Der Diagrammcode wird bei Bedarf geladen (ca. 1,5 MB, 480 kB gezippt), sobald ein Widget mit dieser Einstellung zum ersten Mal angezeigt wird, da weder vis-2 noch der Host des Geräts eCharts gemeinsam nutzen. Eine Seite ohne ein solches Widget lädt keine zusätzlichen Daten. Der iFrame bleibt die Standardeinstellung und die einzige Möglichkeit für die eigenständige URL und die Vorschau im Editor.
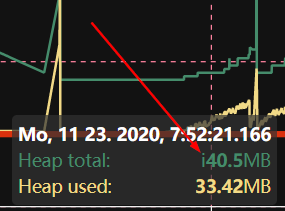
Tooltip
Kleinbuchstaben i Dies bedeutet, dass der Wert aus den Werten der beiden Nachbarwerte interpoliert wurde und zum aktuellen Zeitpunkt nicht existiert.
Daten aus JSON
Sie können die Datenquelle aus JSON definieren. In diesem Fall können Sie einen benutzerdefinierten Zustand vom Typ erstellen. json und speichern Sie den Wert folgendermaßen:
[
    { "ts": 1675887847000, "val": 45 },
    { "ts": 1675887848000, "val": 77 },
    { "ts": 1675887849000, "val": 180 }
]
Folgende alternative Attributnamen werden unterstützt: val: value, v, data, y Und im Anschluss daran für ts: time, t, date Die
Start- und Endzeitpunkt können in den ECharts-Einstellungen nicht definiert werden. Sie werden automatisch aus den Daten berechnet. Eine Aggregation ist ebenfalls nicht möglich. Alle Änderungen müssen durch Schreiben der JSON-Daten erfolgen. Das Diagramm wird bei jeder Wertänderung automatisch aktualisiert.
Serverseitiges Rendering
Sie können die Voreinstellungen auf dem Server rendern und als Base64-URL abrufen oder auf der Festplatte in der ioBroker-Datenbank speichern:
sendTo(
    'echarts.0',
    {
        preset: 'echarts.0.myPreset', // the only mandatory attribute

        renderer: 'svg', // svg | png | jpg | pdf, default: svg

        width: 1024, // default 1024
        height: 300, // default 300
        background: '#000000', // Background color
        theme: 'light', // Theme type: 'light', 'dark'

        title: 'ioBroker Chart', // Title of PDF document
        quality: 0.8, // quality of JPG
        compressionLevel: 3, // Compression level of PNG
        filters: 8, // Filters of PNG (Bit combination https://github.com/Automattic/node-canvas/blob/master/types/index.d.ts#L10)

        fileOnDisk: '', // Path on disk to save the file.
        fileName: '', // Path in ioBroker DB to save the files on 'echarts.0'. E.g. if your set "chart.svg", so you can access your picture via http(s)://ip:8082/echarts.0/chart.png

        cache: 600, // Cache time for this preset in seconds, default: 0 - no cache
    },
    result => {
        if (result.error) {
            console.error(result.error);
        } else {
            console.log(result.data);
        }
    },
);
Achtung: Auf Touch-Geräten mit aktiviertem Zoom können die Linien in der Legende nicht aktiviert/deaktiviert werden.
Entwicklerhandbuch
Für Nicht-Entwickler funktioniert dieser Link nicht!
Sie können Ansichtsdiagramme lokal debuggen mit:
- cd iobroker.echarts/src-chart
- npm run start
- Browser: http://localhost:8081/adapter/echarts/tab.html?dev=true
Todo
- Widget für vis (Schaltfläche)
- Enum-Symbole auf oder in der Nähe von Ordnern anzeigen
Changelog
WORK IN PROGRESS
- (@GermanBluefox) A value of a line without a unit does not end in the word "undefined" any more. The unit was hung onto the value whether the line carried one or not, which a gauge showed as "0,00undefined"
- (@GermanBluefox) The names and the values in the middle of the rings of a gauge do not lie on each other any more. They stood at a share of the radius, while both of them are of a size given in pixels, so they ran into each other as soon as the chart was drawn big
- (@GermanBluefox) Every axis of a radar is labelled with the name of its line again. A series of the type "polar" is built without a name, and the radar read exactly that, so every axis stood there as "undefined"
- (@GermanBluefox) A gauge reads the "Max" and the "Min" of a line, as the radar reads the "Max" as the end of its axis. Only where a line says nothing do the ends of the whole gauge count, and after them the values. Where the lines end at different places every one of them is drawn as how full it is and the scale counts percent - the badges keep showing what the states really say
- (@GermanBluefox) Of the axis settings of a line a gauge shows only "Min" and "Max". Position, ticks and offsets belong to an axis a line runs along, which a gauge does not have - the radar has narrowed the same group from the beginning
- (@GermanBluefox) A gauge shows the current value of a line whatever aggregation the line carries. A line on "unprocessed" or "max" read the history instead, which left every ring and every pointer at zero
- (@GermanBluefox) The aggregation of a line is hidden in the donut and in the gauge, as the chart type already is. Neither of them reads the history, so the setting had no effect there
- (@GermanBluefox) The ends of a gauge scale that are left empty follow the values instead of standing at 0..100, where every pointer sat at the stop. The badge under a value is as wide as the value needs
- (@GermanBluefox) The label of a slider is translated. "Percentile", "Fill (from 0 to 1)" and the thickness of a ring stood in English in every language
- (@GermanBluefox) New chart mode "Gauge", in two shapes: "Circles" stacks a ring per line with the names and the values in the middle, "Gauge" keeps the open scale and gives every line a pointer. The ends of the scale and the thickness of a ring are configurable
- (@GermanBluefox) The radar stands in the "Chart mode" as well and is not a type of a single line any more. An old preset whose lines carry "polar" is read as that mode, in the chart and in the editor
- (@GermanBluefox) A chart drawn without an iframe does not grow any more. It measures the box it stands in, and in a layout whose rows follow their content it kept measuring itself; it now sits in a box of its own that is out of the flow
- (@GermanBluefox) A chart drawn without an iframe does not crash any more when a time range is handed to it while the preset is still being read
- (@GermanBluefox) A switch of the chart mode redraws the chart instead of merging the new one into the old. Switching from the bars to the donut left the axes, the grid and the old bars standing under the ring
- (@GermanBluefox) The ID of a line is reported when it is done - on Enter or when the field is left. Every single keystroke used to rebuild the whole line, which took the focus out of the field after the first letter, and asked the server for an object that cannot exist yet
- (@GermanBluefox) The source of a line offers no history instances any more where none is read - only "standard" and "JSON" are left for a donut, a radar or a line with the aggregation "current". A source that is already stored stays in the list, so no preset changes behind the back of the user
- (@GermanBluefox) A JSON source works in a chart that shows one value per line: its last entry is taken as the current value, which used to happen only when the legend showed actual values
- (@GermanBluefox) Any state can be picked for a line that shows only its current value - a donut, a radar or a line with the aggregation "current" never reads the history, so the object dialog does not limit itself to the states a history adapter logs any more
- (@GermanBluefox) The chart type of a line is hidden in the modes that draw one value per line. A donut knows no line types, and with "Bar (current value)" every series ends up as a bar whatever the line says
- (@GermanBluefox) The "Chart mode" stands over the list of the data sources as well, not only in the options - it decides what a line even means
- (@GermanBluefox) The tooltip of a dropdown stays away while its list is open. It used to lie over exactly the entries the user wanted to read
- (@GermanBluefox) The widget for ioBroker.devices can draw the chart without an iframe too, with the same setting as the vis-2 widget
- (@GermanBluefox) The setting "After comma" of a chart is used again. It has always been written into the preset but was read by nobody, so a line without its own "Digits after comma" printed whatever the aggregation produced - down to 434.32000000000005. An axis leaves a value alone that would round away to zero
- (@GermanBluefox) The vis-2 chart widget can draw the chart without an iframe (attribute "Without iframe", experimental). One socket connection for the whole view instead of one per chart, and the theme of vis-2; the chart code is loaded on demand
- (@GermanBluefox) New chart mode "Donut": one ring with one slice per line, showing the current value of its state. Hole size, labels, the text in the hole and the order of the slices are configurable
- (@GermanBluefox) The whole chart has a "Chart mode" now: Mixed, Donut or Bar (current value). The checkbox "One bar per line" became the mode "Bar (current value)"; old presets are migrated when they are read
- (@GermanBluefox) New vis-2 widget "E-Charts time range": type, end and range as in the preset editor, each field switchable, for one or more chart widgets of the same view
- (@GermanBluefox) A chart that is opened with a preset reads the time range out of the URL hash, and not only
rangeandrelativeEndany more buttimeType,start,start_time,endandend_timeas well. A range that arrives later is taken over without reloading the chart - (@GermanBluefox) The source "standard" can be selected in the opened settings of a line too. Only the closed line offered it, so a line that was set to a certain history instance could not be handed back to the default history adapter there
- (@GermanBluefox) The source of a line shows the icon of the history adapter beside its name, in the closed line as well as in the opened one. "standard" carries the icon of the adapter it stands for
- (@GermanBluefox) The buttons "Expand all" and "Collapse all" are shown for a single line and a single marking as well. They were hidden below two entries, although one line can be opened and closed like any other
- (@GermanBluefox) Added description of the vis-2 widget to the palette tooltip
5.1.1 (2026-08-31)
- (@GermanBluefox) Many GUI fixes
5.0.3 (2026-08-10)
- (@GermanBluefox) A line with the aggregation "raw" is drawn again. The step or the count of the preset was sent to the history adapter for such a line as well, although the editor hides both settings for that aggregation, and the line came back empty while the others in the same chart were fine
- (@GermanBluefox) The Y-axis of a line can be scaled logarithmically, in powers of ten. Values of zero or below cannot stand on such an axis and are left out
- (@GermanBluefox) A single line can be smoothed now: "Smoothing" in its settings replaces every value by the average of the last N values of that line. The other lines of the chart keep their own values, and a gap stays a gap. Only for lines - a bar already averages over its interval
- (@GermanBluefox) A room and a function bring their own color and their own icon into the chart list, as they have them in the admin. The icon takes the place of the folder, which would only stand beside it and say nothing. A group without an icon keeps its folder, and so do the "Others" groups, which are not real enums
- (@GermanBluefox) The alpha slider of the color picker has an effect again. The dialog read the picked color out of
hex, which is six digits and knows no alpha, so the transparency was gone before anybody could see it and the picker showedA: 1again the next time. A color that is not fully opaque is handed on asrgba()now, an opaque one keeps its short hex - (@GermanBluefox) The label over a slider stands as high as the labels of the fields beside it
- (@GermanBluefox) The label "Fill (from 0 to 1)" is translated again. It was renamed in the code, but the translation still stood under the old name and was therefore never found
- (@GermanBluefox) The room and the function filter of the chart list follow the inherited categories now. A room is normally written onto the channel or onto the device and not onto every single state, so only looking at the state itself found nothing and put the whole list under "Others". The way up leads from a state over its channel to its device and ends there, and the nearest station that carries something wins - with all of its enums, as an object can be a member of several
- (@GermanBluefox) The title of an opened line stands on the same line as its folder and its drag handle again
- (@GermanBluefox) The Y-offset takes fractions again, and so do the color threshold, the line thickness and the shadow size. The number fields of the editor read their entry with
parseInt, which threw everything behind the comma away, so a preset lost its fraction as soon as the field was touched. A preset that was saved in between has to get its value entered once more - (@GermanBluefox) A scatter plot draws its points again. It shared the rule of the lines, where the points are an addition that "show points" switches on - but a scatter plot consists of nothing else, so the chart stayed empty as long as that switch was off
- (@GermanBluefox) The title and the legend can stand outside the chart now, over it or under it. Both could only be placed somewhere inside before, where they lie over the lines. The grid gives up the place they need, and if both stand on the same side the title takes the outer row
- (@GermanBluefox) The tooltip of a step chart shows the value the step really carries now. It was interpolated between the two neighbours, which is right for a line but not for a step: between two points such a line holds one value. As that value was measured, it also stays in the tooltip when "no interpolation" is switched on, so lines with unsynchronized time stamps are shown together again
- (@GermanBluefox) Bars that share a Y-axis and are drawn on each other can show the sum of the whole stack over it now. The option sits in the bar settings next to the labels, and every stack carries the unit and the decimals of the line that owns its axis
- (@GermanBluefox) A range that ends with "this month" does not jump over a month anymore. On the 31st the month was counted up first and the 1st set afterwards, so a month with only 30 days rolled over into the one after it and the chart ended a whole month too late
- (@Voodoo2man) A preset can show a range selector in the chart now. It puts a calendar icon next to the other buttons on the right edge, and the range picked there changes the shown period without touching the preset. It also drops a zoom, because a zoomed window would swallow the new range
- (@GermanBluefox) The CSV export button does not hang over the chart anymore: the grid left a place for the button on the right edge only for the image export, so the CSV icon was drawn on top of the last values
- (@GermanBluefox) Every bar hangs on the Y-axis of its own line now. All of them were drawn on the axis of the first line, so a chart with e.g. a power in kWh and a collector temperature in °C pressed one of them flat on the bottom while its own axis stayed empty. Bars are only stacked on each other if they really share an axis
- (@GermanBluefox) A free bar interval below one minute or a negative one froze the browser: the walk over the intervals never reached the end of the range. Such a value falls back to "auto" now
- (@GermanBluefox) A relative time range holds whole bars now. "7 days" with daily bars gave eight of them, the first and the last one holding only a part of their day, and "1 month" gave 32. The range is measured from the border of the last bar now, so it shows exactly as many bars as it is long. A static or a zoomed range stays the window the user picked himself
- (@GermanBluefox) A single value that is not a real number does not make the Y-axis disappear anymore. A convert formula like
100 / valgives infinity as soon as one value is zero, and that stretched the axis so far that ECharts drew no label and no grid line at all. Such a point is a gap in the line now - (@GermanBluefox) Fixed the server-side rendering of a JSON source whose time stamps are text: the reading used
window, which does not exist there yet, so the source stayed empty - (@GermanBluefox) Fixed the Y-axis of a chart that is updated: it grew with the values but never shrank again, so a JSON source that switched to smaller values kept the much too high scale and the line was pressed flat onto the bottom
- (@GermanBluefox) Fixed the X-offset of a line: the unit was read from the second and the third character, so
-12mcounted as -12 seconds instead of -12 months, and an offset like1dor1hsilently became one second. Hours, days and weeks can be written out now as well - (@GermanBluefox) An offset of whole months or years does not jump into the following month anymore: one month before the 31st of March is the 28th of February now and no longer the 3rd of March
- (@GermanBluefox) Fixed the bar charts of a JSON source: a value that lies exactly on an interval border, like a counter that is written at 00:00, lost its bar. With only one value the chart stayed empty
- (@GermanBluefox) A JSON source that is updated shows its new bars now instead of dropping everything behind the range, and a rolling window does not leave empty bars at the beginning anymore
- (@GermanBluefox) A second JSON source of a bar chart is no longer cut off at the time range of the first one
- (@GermanBluefox) Copying a preset, creating one and opening one over the address bar ask to save the unsaved changes of the current preset now, like switching to another preset already did. The question comes before the new preset is written, so a cancel leaves nothing behind
- (@GermanBluefox) The button "Save current preset and load" is only offered if a preset is open at all, it answered with "Invalid object" for a data point picked from the list
- (@GermanBluefox) Fixed an old preset counting as changed as soon as anything was touched, even after the change was taken back
- (@GermanBluefox) A line on a shared Y-axis shows the inherited unit in a disabled field now instead of hiding it, so it is visible where the unit comes from
- (@GermanBluefox) A line that shares the Y-axis of a line that does not exist gets an own axis now instead of stopping the whole chart
- (@GermanBluefox) The interval of the bars can be entered freely in minutes now, e.g. 90 for one and a half hours or 4320 for three days
- (@GermanBluefox) Fixed the first and the last label of a bar chart being cut off at the border: the place beside the grid is calculated from their width now
- (@GermanBluefox) The text of a marking with an upper and a lower limit is drawn only once now and not at both border lines
- (@GermanBluefox) Fixed the Y-axis being pulled back over the upper limit of a marking, which could push the marking out of the visible area
- (@GermanBluefox) A marking widens the Y-axis of its own line now and no longer always the first one of the chart
- (@GermanBluefox) Fixed the sorting of the data of a JSON source: the values were not ordered by time, so the legend showed the oldest value instead of the newest one
- (@GermanBluefox) Added "1 week" as interval for the bar charts. The bars start on Monday, like the ISO calendar week. "auto" takes it for a range of 60 days up to half a year, which used to give only a handful of monthly bars
- (@GermanBluefox) Added the calendar week to the list of the time formats, with and without the German prefix "KW"
- (@GermanBluefox) The bar interval of one month was still offered as "30 days" in the editor
- (@GermanBluefox) Fixed a chart with a static time range walking one day into the future with every update
- (@GermanBluefox) The header of the tooltip of a bar chart respects the X-label offset now, so it shows the same date as the axis below it
- (@GermanBluefox) The bar charts respect the color and the number of the X-ticks now, and their ticks are hidden together with the axis
- (@GermanBluefox) The bar charts can draw a shifted line on the main time range too, so a value that carries the time stamp of the following interval can be moved into the interval it belongs to
- (@GermanBluefox) Fixed the drawing of a shifted line with an offset in months or years: it is moved in the calendar now and does not wander away from the 1st of the month anymore
- (@GermanBluefox) Added the option to draw one bar per line instead of one bar per time interval, so the X-axis is a list of data points, e.g. the consumption of every device. The bars can lie horizontally too
- (@GermanBluefox) Fixed the aggregation "current value": it stopped the reading of the chart with an error, so the radar charts stayed empty since v2.0.0
- (@GermanBluefox) The Y-axis does not open a negative area anymore if the values are never negative
- (@GermanBluefox) Fixed the confusing date in the tooltip: it uses the date format of the language of the user now
- (@GermanBluefox) The server-side rendering formats the dates in the language of the system now and not always in English
- (@GermanBluefox) The zoom and the pan stop at the end of the time range now, so the user cannot scroll into the future by accident. It can be switched off per preset
- (@GermanBluefox) Added the option to draw a line without an entry in the legend, e.g. for a value that is only a background
- (@GermanBluefox) Fixed the server-side rendering: the actual value was missing in the legend
- (@GermanBluefox) The server-side rendering measures the axis labels with the canvas now instead of estimating them, so the charts are no longer too narrow
- (@GermanBluefox) Fixed the X-axis labels being cut off with a bigger font: the place for them is calculated from the font size now
- (@GermanBluefox) Added a second color for the values below a threshold, e.g. green while charging and red while discharging a battery
- (@GermanBluefox) Lines with the same name are shown as one entry in the legend and as one row in the tooltip now
- (@GermanBluefox) Added the option to draw a line with X-offset on the main time range, so it can be compared with the not shifted lines
- (@Brainbug01) Fixed the white screen when opening the legend or export dialog
- (@GermanBluefox) Fixed the bar charts: the values were shown one interval too late
- (@GermanBluefox) Fixed the bar charts: the months are counted in the calendar now and not as 30 days
- (@GermanBluefox) Fixed the bar charts: no additional empty bar is added at the end of the range anymore
- (@GermanBluefox) Fixed the
differenceprocessing of the bar charts: the first bar is not lost anymore - (@GermanBluefox) The configured time format is used for the X-axis labels of the bar charts too
5.0.2 (2026-08-10)
- (@GermanBluefox) Show a state under every history instance that logs it and not only under the first one
- (@GermanBluefox) Fixed the line break in the X-axis labels for the time formats like
HH:MM / dd.mm.yy
5.0.1 (2026-08-08)
- (@Brainbug01) Fixed server-side rendering hanging until the caller timed out (preview showed "timeout" for every preset)
- (@GermanBluefox) Aligned the GUI of the editor, the preview and the chart with the admin 8 design
- (@Brainbug01) Fixed creating a preset in a folder
5.0.0 (2026-08-03)
- (@GermanBluefox) Update to ECharts 6.1.0 and React 19
License
ioBroker.echarts is available under the Apache License V2.
Copyright (c) 2019-2026 @GermanBluefox dogafox@gmail.com
Apache ECharts Copyright (c) 2017-2026 The Apache Software Foundation
This product includes software developed at The Apache Software Foundation (https://www.apache.org/).