Konfiguration
DB-Einstellungen
Hier werden die Einstellungen, die beim Anlegen der influxDB gemacht wurden eingegeben, damit der ioBroker-Server Zugriff auf diese Datenbank erhält. 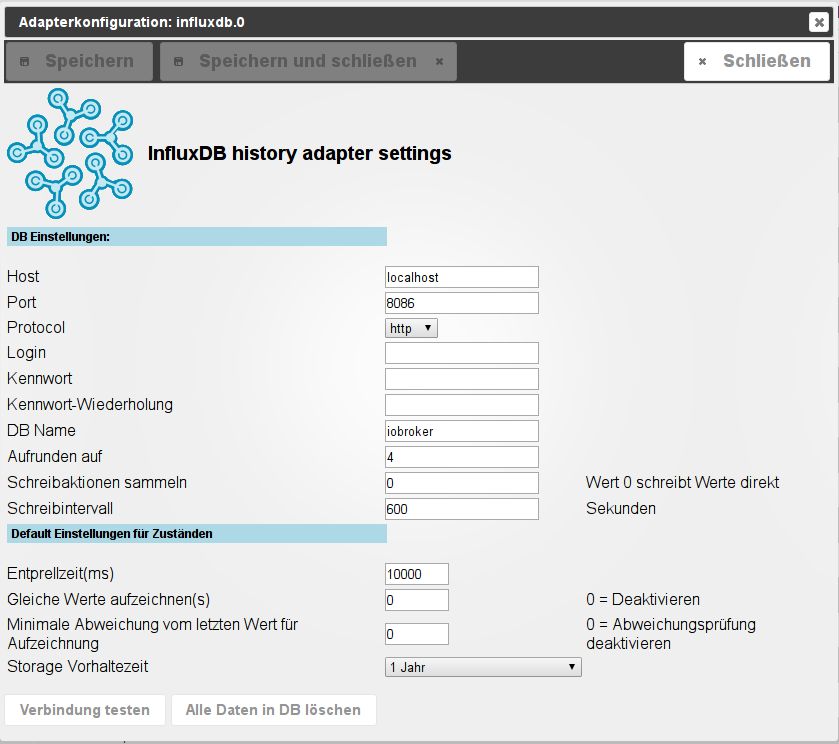
Host
Hostname oder IP des Datenbank Servers.
Port
hier wird der Port eingegeben über den die Datenbank auf dem Host zu erreichen ist.
Protocol
Hier wird angegeben ob der Zugriff auf die Datenbank per einfachem http oder gesichertem https durchgeführt werden soll
Login
Der Besitzer der Datenbank (User) unter dessen ID die Daten aufgezeichnet werden sollen
Passwort
Dieses ist das Passwort des angegebenen Users in der SQL-Datenbank. Zur Sicherheit muss dieses Passwort im folgenden Feld wiederholt eingegeben werden.
Aufrunden auf
Angabe der Nachkommastellen mit denen Zahlen gespeichert werden sollen.
Schreibaktionen sammeln
Der hier eingegeben Wert bestimmt wieviele neue Daten vorliegen sollen, bevor wieder in die Datenbank geschrieben werden soll. Je höher der Wert, desto seltener wird in die DB geschrieben, desto höher ist aber der Datenverlust bei Ausfall des Adapters. Eine 0 sorgt für sofortigen Eintrag in die DB. Dementsprechend bedeutet die Eingabe "0": Sofortiges Schreiben in die Datenbank. Dies erhöht die Last auf der Datenbank und im Adapter.
Schreibintervall
Wird hier ein Wert eingegeben werden die Daten bereits nach der vorgegebenen Zeit in Sekunden in die Datenbank geschrieben, auch wenn die im letzten Punkt eingestellte Anzahl von Daten noch nicht erreicht ist.
Default Einstellungen für Zustände
Diese Einstellungen geben die Werte vor, die bei der Konfiguration des Loggings der einzelnen Datenpunkte als Vorgabe genutzt werden sollen. 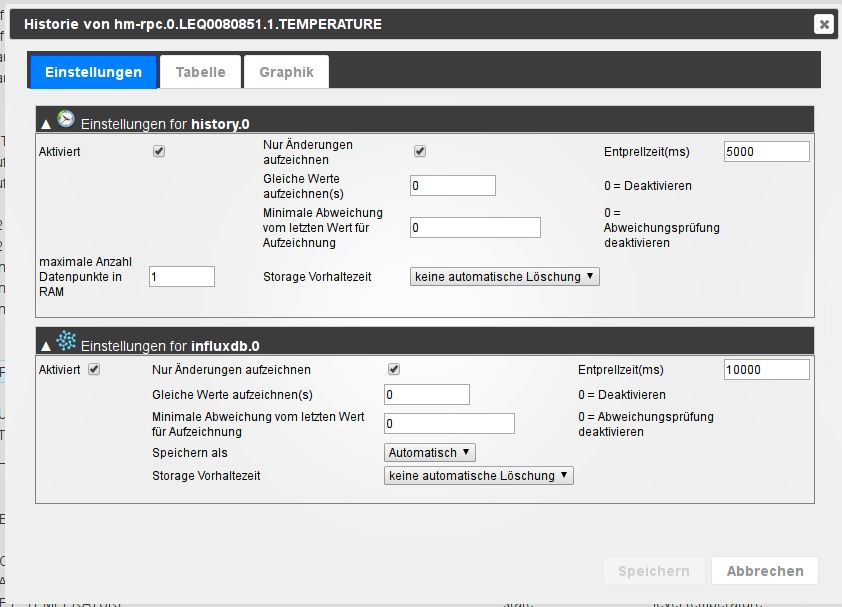
Nur Änderungen aufzeichnen
Ist diese Checkbox angehakt müssen aufeinanderfolgende Daten unterschiedliche Werte haben damit sie aufgezeichnet werden. Sendet ein Sensor, z.B. mehrfach die gleiche Temperatur wird dies nicht aufgezeichnet, erst bei einer Änderung wird wieder eine Datensatz angelegt.
gleiche Werte aufzeichnen
sollen bei gleichem Wert von Zeit zu Zeit trotzdem diese (unveränderten) Werte gespeichert werden, kann hier eine Zeitspanne in Sekunden festgelegt werden, wie häufig dieses geschehen soll. Dementsprechend bedeutet die Eingabe 0, dass kein doppelter Wert gespeichert werden soll.
Minimale Abweichung vom letzten Wert
sollen bei ständig wechselnden Werten trotzdem diese (geänderten) Werte nicht gespeichert werden, kann hier ein Mindestwert festgelegt werden, den sich der Wert ändern muss, damit wieder ein neuer Wert gespeichert wird. Dies ist beispielsweise bei Strommesssteckdosen sinnvoll, bei dem nicht jede leichte Veränderung geloggt werden soll. Dementsprechend bedeutet die Eingabe 0, dass jeder Wert gespeichert werden soll.
Speichern als
Wenn nötig kann hier der Datentyp festgelegt werden mit dem die Daten gespeichert werden sollen. Dies sollte nur vor der ersten Aktivierung durchgeführt werden.
 In einer InfluxDB wird der Datentyp mit dem ersten Datensatz festgelegt und muss danach identisch bleiben.
Storage Vorhaltezeit
Legt fest, wie lange die Werte gespeichert werden sollen (unendlich, 2 Jahre, 1 Jahre, …, 1 Tag). 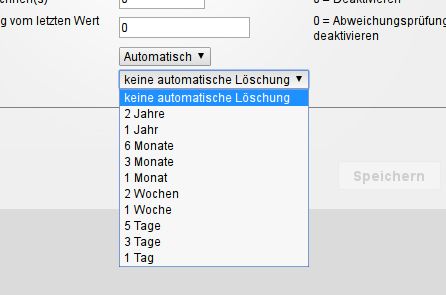
Entprellzeit (ms)
Schutz vor zu häufigen Änderungen eines Wertes. Dies ist der Mindestabstand in Millisekunden bis wieder ein Wert geschrieben wird.
Einstellungen für Datenpunkte
Die Einstellungen für die zu loggenden Datenpunkte werden in dem Reiter „Objekte“ bei dem entsprechenden Datenpunkt durchgeführt.  Dazu wählt man ganz rechts in der Spalte das Zahnradsymbol zu dem gewünschten Datenpunkt aus. Das Konfigurationsmenü öffnet sich:
Aktiviert
Logging des Datenpunktes aktivieren Nur Änderungen aufzeichnen: Es werden nur Werte gespeichert, wenn sich der Wert des Datenpunktes ändert. Das spart Speicherplatz.Eine sinnvolle Nutzung ergibt sich, wenn man vorher über die Filterfelder in dem Tabellenheader die Datenpunkte so filtert, dass man z.B. nur die „State“ Datenpunkte herausfiltert, um sie dann zu loggen 
- die Ansicht als Liste ohne Gruppierung anzeigen lassen
- den oder die Filterbegriffe eingeben
- alle gefilterten Datenpunkte zum loggen auswählen
- Das Konfigurationsmenü für die Einstellungen der log-Parameter öffnet sich
- Das loggen für alle gefilterten Datenpunkte auf einmal aktivieren
- Weitere Parameter wie „nur Änderungen“ und Vorhaltezeit für alle gefilterten Datenpunkte einheitlich auswählen
- Die Änderungen speichern
Bedienung
Wählt man in der Titelzeile unter Historie "mit" oder "influxdb.0" aus, werden nur noch Datenpunkte mit Logging angezeigt.  Ein Klick auf das Zahnradsymbol öffnet die geloggten Daten:
 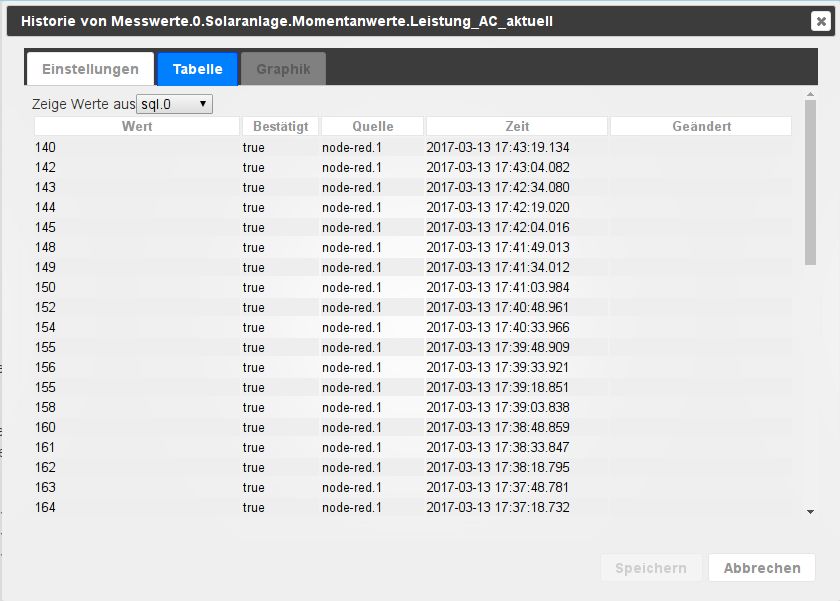 Im Reiter Table werden die Daten tabellarisch angezeigt.
 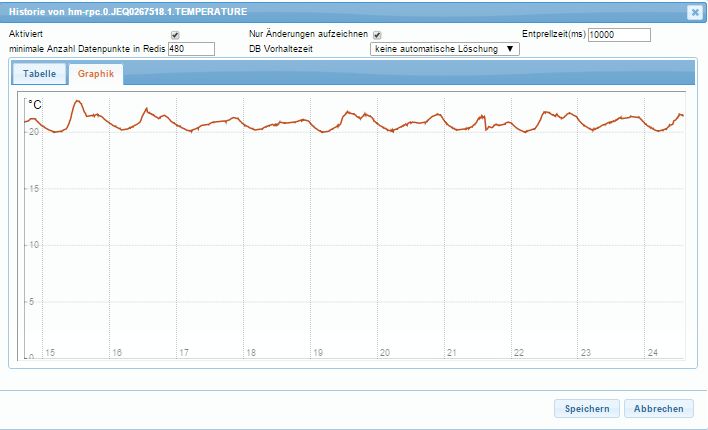 Im Reiter Chart kann bei installiertem Rickshaw-Adapter eine Verlaufsgrafik angezeigt werden.
Installation einer influxDB Datenbank
Die Beschreibung einer Installation einer influxDB-Datenbank folgt.
Changelog
5.0.4 (2026-08-28)
- (@GermanBluefox) Fixed Grafana not finding the InfluxDB running next to it in Docker: the provisioned data source pointed at
iob_influxdb_<instance>, while the container was namediob_influxdb_<instance>_flux_databecause the compose file gave it a name of its own. Inside the shared network only the container name resolves, so the data source could not connect. The influx service uses the default name of the instance now - the name the data source andtestConnection()both expect - (@GermanBluefox) Fixed the port of that data source: it used the port published on the host, although Grafana reaches InfluxDB inside the docker network, where the container port 8086 applies. The data source broke as soon as the port was changed in the settings
- (@GermanBluefox) Fixed the Grafana container never being started when Grafana is enabled and InfluxDB is not: the plugin waits for the readiness signal of the adapter before it starts any container of the instance, and that signal was only sent when both were switched on. That state is reachable by switching InfluxDB off afterwards - the Grafana checkbox is hidden then, but its stored value stays
- (@GermanBluefox) The "automatic image update" setting of Grafana had no effect: the compose file never passed it on to the plugin
- (@GermanBluefox) Existing installations with InfluxDB in Docker have to remove the old container once, because it is renamed by the first fix:
docker rm -f iob_influxdb_<instance>_flux_data. It still holds the published port, so the correctly named container cannot start next to it. The data is not affected - it lives in the volumes, which keep their names
5.0.3 (2026-08-27)
- (@GermanBluefox) Errors are logged with more detail: error code,
causeand a driver-specific error name (HttpError,ServiceNotAvailableError) are shown now, and a nested error without a message no longer degrades to{}(same implementation as in the SQL adapter) - (@GermanBluefox) A switched-off or unreachable InfluxDB no longer floods the log (and syslog): a connection error is now recognized by its error code - Node reports a failed TCP connect as an
AggregateErrorwith an empty message, which no check could match before - so the points are buffered and a reconnect is scheduled instead of retrying every single point. The repeated error is logged once and afterwards only once an hour - (@GermanBluefox)
getHostsAvailable()reports the real state again: it returned a hardcoded1since the TypeScript port, so every "host not available" check in the adapter was dead code. After a connection error the host is now taken out of rotation for a short backoff and values are buffered instead of being written - and logged - point by point - (@GermanBluefox) A failing buffer flush inside the interval timer no longer produces an unhandled promise rejection, which terminates the adapter process on current Node.js versions
- (@GermanBluefox)
storeStateanswers with an error again if a value cannot be stored (null,NaN, or a non-numeric value for aNumberdatapoint) instead of reportingsuccess: trueand silently discarding it; on the state-change path such a value is still logged only once per datapoint - (@GermanBluefox) The warning about an
undefinedstate value is logged only once per datapoint as well
5.0.2 (2026-08-26)
- (@GermanBluefox) Added the data browser to the configuration, so the stored values can be viewed, edited and deleted.
- (@GermanBluefox) The aggregation is used now from
@iobroker/aggregateand is shared with the history and SQL adapters. - (@joltcoke) Fixed average and total returning null for every interval that contains a null value: parseFloat(null) is NaN and poisoned the sum of the whole interval (thanks to @joltcoke, ioBroker/ioBroker.sql#526). As the result was NaN and not null, ignoreNull could not act on it either
- (@joltcoke) Fixed min returning a wrong value if the interval contains a null, minmax losing the minimum if the interval starts with a null, and percentile/quantile counting a null as 0
5.0.1 (2026-08-15)
- (@GermanBluefox) Completely refactored the code to TypeScript and ES6
- (@GermanBluefox) Added possibility to start docker containers directly from the adapter
- (mcm1957) Adapter requires admin >= 7.7.2 now
- (arteck) Fixed the connection handling for InfluxDB 1.x: the health check (ping) and the automatic reconnect were never started
- (arteck) Fixed the loss of buffered values if the writing was running while new values arrived or if the write failed
- (arteck) Values are no longer written twice if they are written directly (buffer size 0 or conflicting points)
- (arteck) State IDs and database names are now escaped in the queries
- (arteck) The password/token is no longer written into the log by the connection test
- (arteck) The settings "request timeout" and "validate SSL" are now used for InfluxDB 1.x too
- (arteck) Fixed the cache file name if more than one instance runs in the compact mode
- (arteck) Fixed the aggregation for
percentile: 100/quantile: 1and the last value ofintegralTotal - (bluefox) Fixed empty charts for the aggregation
onchange("raw" in e-charts): it was run through the interval aggregation and returned onlynullvalues - (@GermanBluefox) Minimal node.js version is 22
4.0.3 (2024-05-16)
- (bluefox) Some packages were updated
License
The MIT License (MIT)
Copyright (c) 2015-2026 bluefox, apollon77
Permission is hereby granted, free of charge, to any person obtaining a copy of this software and associated documentation files (the "Software"), to deal in the Software without restriction, including without limitation the rights to use, copy, modify, merge, publish, distribute, sublicense, and/or sell copies of the Software, and to permit persons to whom the Software is furnished to do so, subject to the following conditions:
The above copyright notice and this permission notice shall be included in all copies or substantial portions of the Software.
THE SOFTWARE IS PROVIDED "AS IS", WITHOUT WARRANTY OF ANY KIND, EXPRESS OR IMPLIED, INCLUDING BUT NOT LIMITED TO THE WARRANTIES OF MERCHANTABILITY, FITNESS FOR A PARTICULAR PURPOSE AND NONINFRINGEMENT. IN NO EVENT SHALL THE AUTHORS OR COPYRIGHT HOLDERS BE LIABLE FOR ANY CLAIM, DAMAGES OR OTHER LIABILITY, WHETHER IN AN ACTION OF CONTRACT, TORT OR OTHERWISE, ARISING FROM, OUT OF OR IN CONNECTION WITH THE SOFTWARE OR THE USE OR OTHER DEALINGS IN THE SOFTWARE.