Writes ioBroker datapoint history natively to VictoriaMetrics –
via its JSON-lines import API,
with real Prometheus labels instead of field-name suffixes (as produced e.g. when writing
through the InfluxDB compatibility layer, such as Living_Room_Temperature_value).
Buffers and writes datapoint changes to VictoriaMetrics, and answers getHistory() requests
(so vis chart widgets can query this adapter directly) – see Read path below for
details and known limitations. For visualization outside of vis (e.g. Grafana), query
VictoriaMetrics directly via PromQL instead. This adapter is not yet listed in the official
ioBroker repository.
Documentation in other languages: Deutsch
Requirements
- A running VictoriaMetrics instance (single-node), reachable via HTTP(S) – see Installing VictoriaMetrics below
- ioBroker js-controller >= 6.0.11, Admin >= 7.0.23
Installing VictoriaMetrics
VictoriaMetrics runs as a single, self-contained binary/Docker image – no separate database server setup like InfluxDB is needed. Official installation guides for all platforms (Linux binary, Docker, Kubernetes Helm chart, …): see the VictoriaMetrics documentation.
Via Docker
docker run -d --name victoriametrics \
  -p 8428:8428 \
  -v victoria-metrics-data:/victoria-metrics-data \
  victoriametrics/victoria-metrics:latest \
  --storageDataPath=/victoria-metrics-data \
  --retentionPeriod=100y
VictoriaMetrics is then reachable at http://<docker-host>:8428 (health check:
http://<docker-host>:8428/health, VMUI: http://<docker-host>:8428/vmui/). Official
Docker image: victoriametrics/victoria-metrics on Docker Hub.
For persistent operation, use a volume/bind mount for -storageDataPath (see above) and,
depending on your environment, a docker-compose.yml with restart: unless-stopped.
Without Docker
Download the statically linked binary for your platform from the GitHub releases page, unpack and start it:
./victoria-metrics-prod --storageDataPath=/path/to/data --retentionPeriod=100y
Detailed installation guides (incl. systemd service, Kubernetes, cluster setup) in the official documentation.
Configuration
"Connection" tab
| Field | Description |
|---|---|
| Protocol | http or https |
| Host / IP address | Hostname/IP of the VictoriaMetrics instance, without protocol |
| Port | Default: 8428 |
| Use basic auth | Enables username/password (VictoriaMetrics -httpAuth.*) |
| Timeout (ms) | HTTP request timeout |
The "Test connection" button checks VictoriaMetrics' /health endpoint using the
currently entered (not yet saved) values; on success, the message also shows the currently
configured retention.
On adapter start, the currently configured retention on the VM server is also logged
(VictoriaMetrics reachable at ... (Retention: 100y)) – read-only display, see
Retention below for why this can't be changed via the adapter.
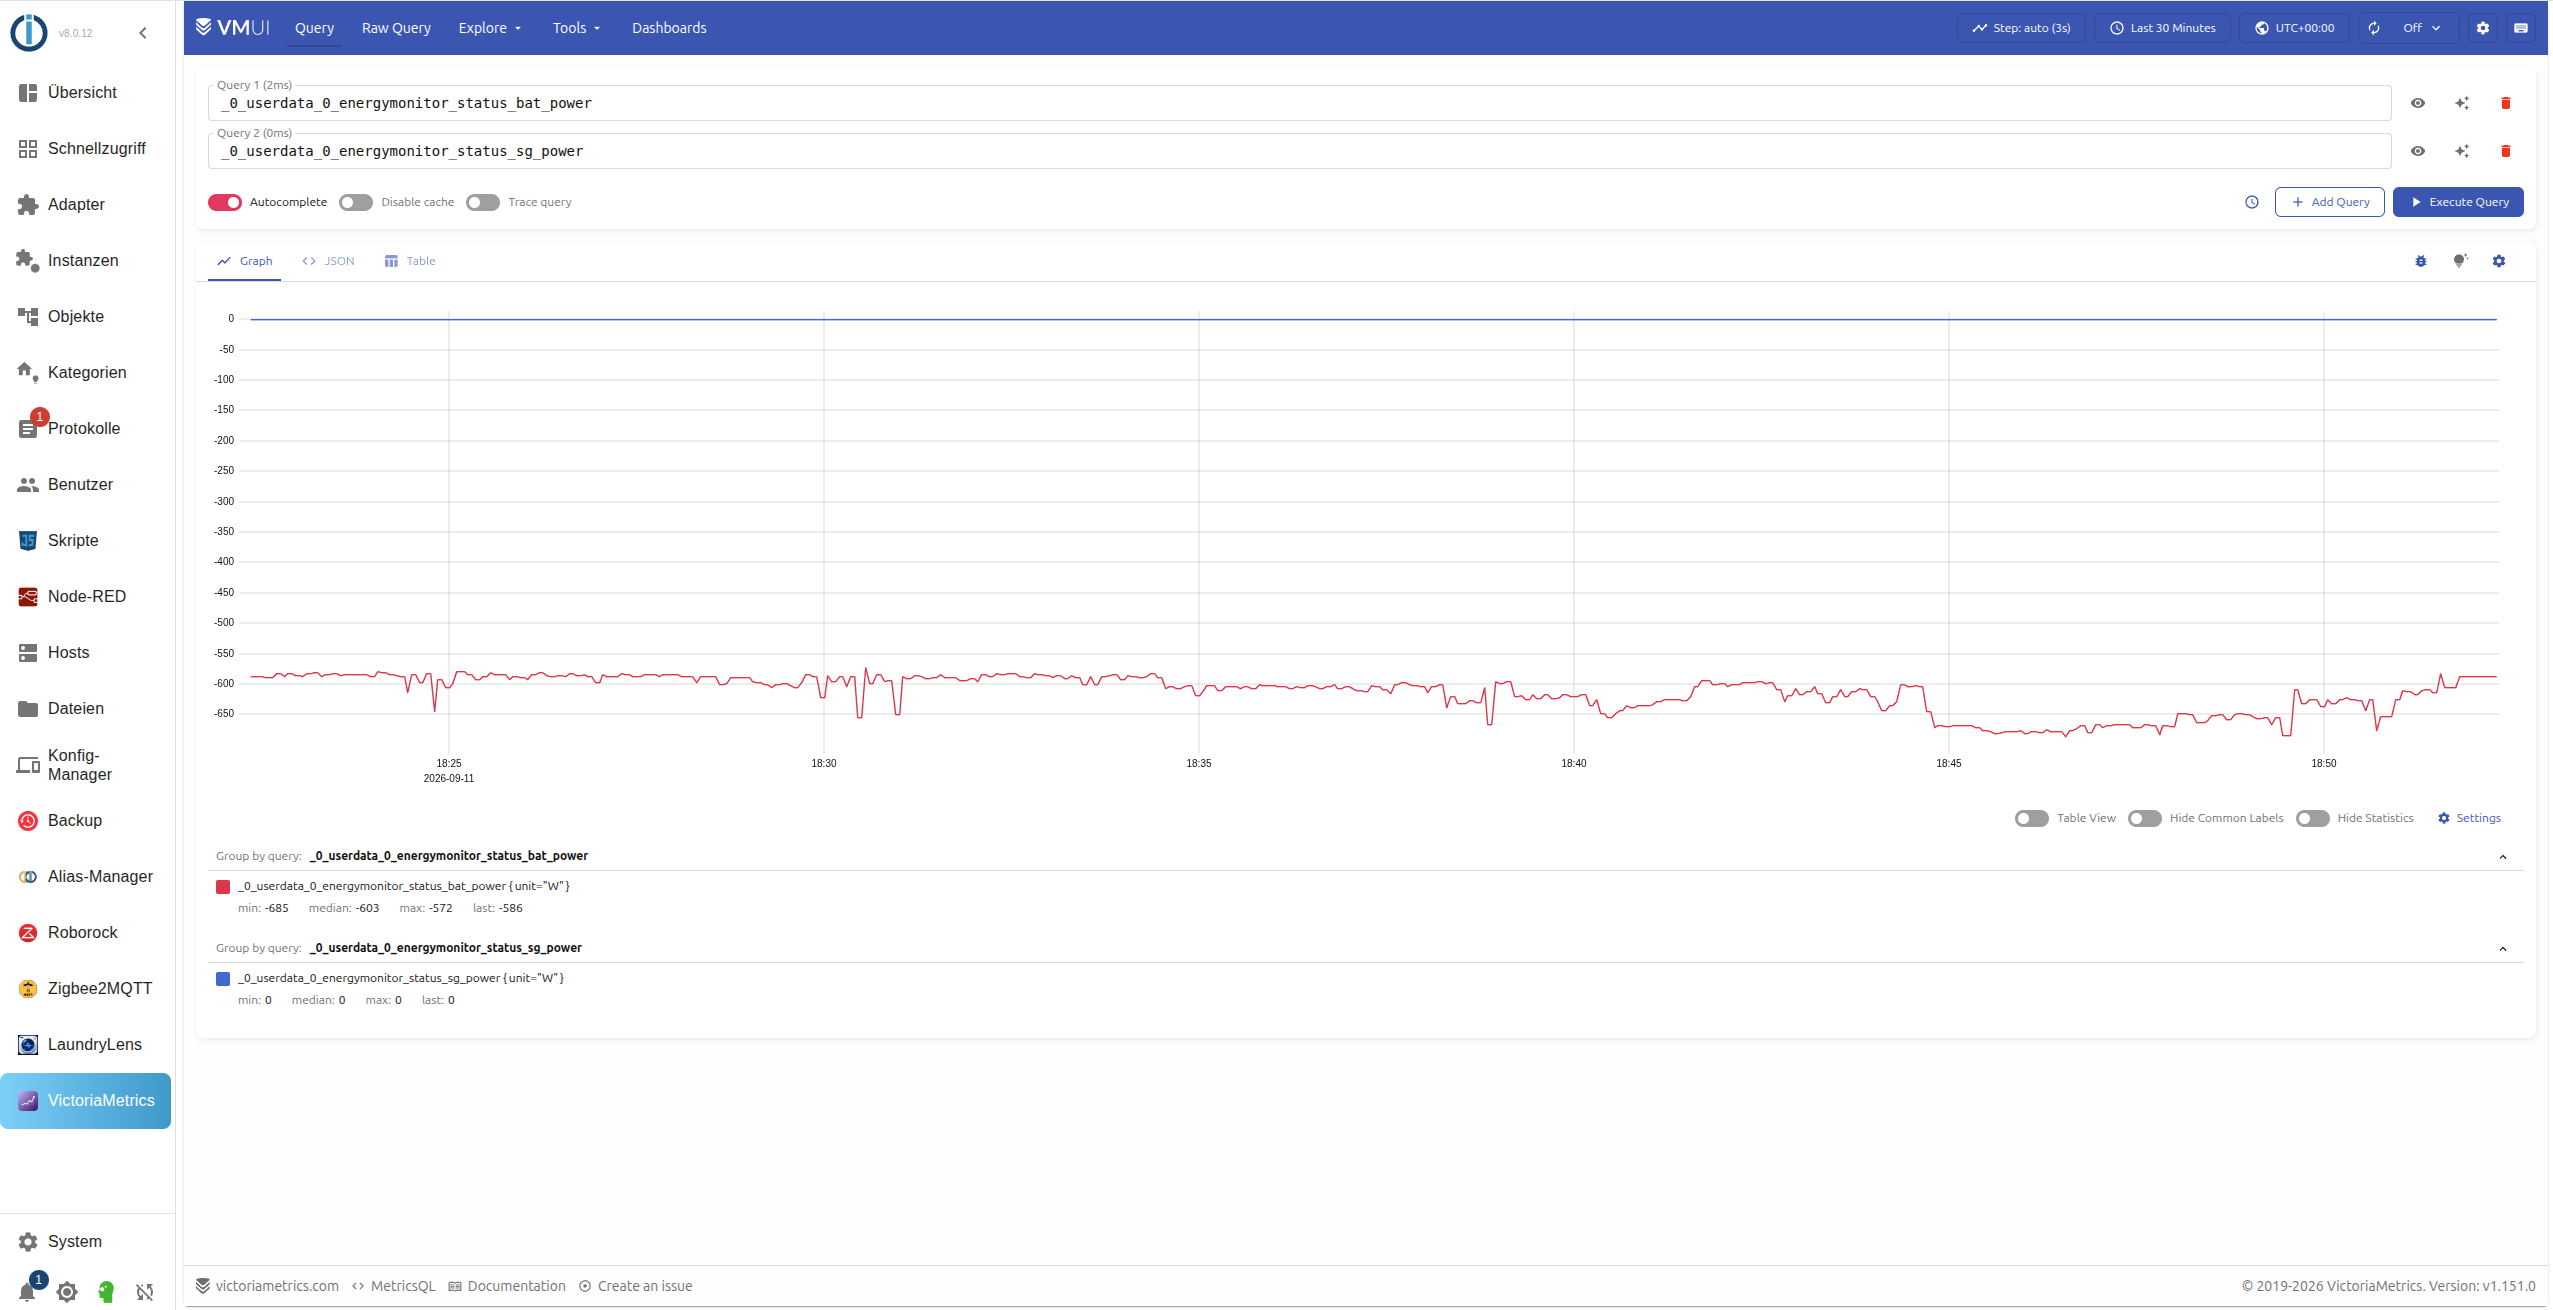
The left sidebar of ioBroker.admin also gets a "VictoriaMetrics" menu entry (similar to
Node-RED/Zigbee2MQTT), embedding VMUI (VictoriaMetrics' own web UI for running PromQL
queries, graphs, etc.) directly at http://<host>:<port>/vmui/. Note: if ioBroker.admin
runs over HTTPS but VictoriaMetrics only over HTTP, the browser blocks the embed (mixed-content
protection) and an empty page opens instead. The only fix is making VictoriaMetrics reachable
over HTTPS as well – there is no workaround inside the adapter.
"Write behavior" tab
| Field | Description |
|---|---|
| Write interval (seconds) | How often buffered values are written in a batch |
| Max. buffer size (points) | Triggers an immediate write once reached |
Enabling history for a datapoint
In the object tree, open the "History" tab for the desired datapoint, select this adapter and enable it via the "Enabled" switch.
| Field | Description |
|---|---|
| Debounce time (ms, optional) | Only logs the value once it has stayed unchanged for the given time (waits for a "settled" value before writing) |
| Block time (ms, optional) | Ignores new values for the given time after the last written value (rate limit) |
| Ignore values below/above (optional) | Threshold filter, e.g. to discard obvious sensor outliers |
| Ignore zero values (0) | Skips values that are exactly 0 |
| Metric name (optional) | Overrides the metric (__name__) automatically derived from the object ID, see below |
| Round to decimal places (optional) | Rounds the value before writing; leave empty for no rounding |
| Minimum change (optional) | Values that differ from the last written value by less than this amount are not written; leave empty for no filtering |
| Log changes only | Only writes a value if it differs from the last written value |
| Relog interval (ms, optional) | Only effective when "Log changes only" is enabled: writes an unchanged value again at the latest after this time, so charts don't show gaps |
Debounce time and block time can be combined with the other filters: debounce time delays writing until the value has been stable for a while; block time limits how often a datapoint is written at most, regardless of whether it changes. "Log changes only" is usable independently of "Minimum change": the former only writes on an exact value change (with an optional periodic relog), the latter filters changes below a threshold.
"Defaults" tab
The same fields (except metric name) can also be set instance-wide, in the instance config tab "Defaults". They apply to all datapoints that don't set their own field in the History tab – so not every single datapoint has to be configured. A datapoint's own value always overrides the instance-wide default.
Metric name derivation
The Prometheus metric name (__name__) is determined as follows:
- If a metric name (
aliasId) is set in the History tab, it is used. - Otherwise the ioBroker object ID is used (not the object name, since that could change unnoticed and silently split the time series).
The chosen name is then normalized: lowercased, . becomes _, any run of invalid characters
is collapsed into a single _, leading/trailing _ are removed, and a _ is prepended if the
result starts with a digit.
Example: javascript.0.Room Temperature → javascript_0_room_temperature. For a short,
descriptive name like room_temperature, use the metric name field.
Data type handling
VictoriaMetrics metrics are fundamentally numeric:
- Numbers are written unchanged.
- Booleans are converted to
0.0/1.0. - Strings are parsed as a number (e.g.
"21.5"→21.5); strings that can't be parsed are skipped with a log warning (no string-label is written, to avoid a cardinality explosion).
A unit label is also set automatically if the ioBroker object defines a unit
(common.unit).
Connection loss & data-loss protection
Values are first collected in a buffer and written to VictoriaMetrics in a batch, at the configured write interval (or once the maximum buffer size is reached).
If a write fails (e.g. VM unreachable), an error counter is increased for every affected datapoint:
- Below a count of
10, the point is buffered again and retried on the next interval. - Once
10is reached, the point is dropped and the counter reset (prevents unbounded buffer growth while VM stays unreachable).
The buffer is also persisted on clean adapter shutdown, and (throttled to at most once a minute) after failed write attempts, so a hard crash (e.g. container restart) doesn't lose data under normal circumstances.
Read path
The adapter answers getHistory() requests (what vis chart widgets call) by reading
datapoints of the requested metric from VictoriaMetrics and handing them to the shared
@iobroker/aggregate library – the same library
iobroker.influxdb, iobroker.sql and iobroker.history use for bucket aggregation
(average/min/max/total/count/percentile/...), gap handling and border interpolation. This
means all standard aggregation types work without this adapter having to reimplement the
bucket logic itself.
Server-side pushdown: for the aggregation methods average, min, max, total and
count with a known time step, VictoriaMetrics computes the result itself via PromQL
(avg_over_time, min_over_time, max_over_time, sum_over_time, count_over_time) – the
adapter then only transfers the finished bucket values instead of every raw point. For
onchange/none/minmax as well as percentile/quantile/integral (no direct PromQL
equivalent), and whenever pushdown fails, it transparently falls back to the raw-data path
(/api/v1/export + JS-side aggregation).
id: '*': returns the latest raw values across all datapoints currently enabled in
Admin (not orphaned metrics from datapoints disabled in the meantime), each with an id
field. Aggregation is not supported for this case (doesn't make sense across different
metrics) – raw values are always returned.
Further known limitations:
- Responses don't include
ack/q/from– the adapter doesn't store these fields in VictoriaMetrics at all - No pre-flush of not-yet-written buffered values before a query (unlike
iobroker.influxdb) – agetHistory()call right after a state change may not see the newest value until the next write interval
Access from the JavaScript adapter
// Last 50 raw values
sendTo('victoriametrics.0', 'getHistory', {
    id: 'javascript.0.exampleValue',
    options: {
        end: Date.now(),
        count: 50,
        aggregate: 'onchange',
    }
}, function (result) {
    for (var i = 0; i < result.result.length; i++) {
        console.log(result.result[i].ts + ' ' + result.result[i].val);
    }
});

// Hourly average of the last 24h
var end = Date.now();
sendTo('victoriametrics.0', 'getHistory', {
    id: 'javascript.0.exampleValue',
    options: {
        start: end - 24 * 3600000,
        end: end,
        aggregate: 'average',
        step: 3600000,
    }
}, function (result) {
    console.log(JSON.stringify(result.result));
});

// Last 20 raw values across all enabled datapoints
sendTo('victoriametrics.0', 'getHistory', {
    id: '*',
    options: {
        end: Date.now(),
        count: 20,
        addId: true,
    }
}, function (result) {
    for (var i = 0; i < result.result.length; i++) {
        console.log(result.result[i].id + ' ' + result.result[i].val);
    }
});
Supported options fields and aggregate values match the ioBroker standard (see the
iobroker.history documentation
for the full reference) – with the limitations noted above.
Data management / script interfaces
The adapter also answers three additional ioBroker message commands (sendTo), e.g. for
scripts or migration tools:
features
Capability discovery:
sendTo('victoriametrics.0', 'features', {}, function (result) {
    console.log(JSON.stringify(result.supportedFeatures)); // ['storeState', 'deleteAll']
});
storeState
Writes one or more historical points, e.g. to import old history from another source (e.g. InfluxDB):
sendTo('victoriametrics.0', 'storeState', {
    id: 'javascript.0.exampleValue',
    state: { ts: 1690000000000, val: 512.3 },
    rules: true, // apply rounding + threshold/zero filters (see below)
}, result => console.log(JSON.stringify(result)));

// also as a batch for the same id:
sendTo('victoriametrics.0', 'storeState', {
    id: 'javascript.0.exampleValue',
    state: [
        { ts: 1690000000000, val: 512.3 },
        { ts: 1690000060000, val: 498.1 },
    ],
}, result => console.log(JSON.stringify(result)));

// or as an array of multiple ids:
sendTo('victoriametrics.0', 'storeState', [
    { id: 'javascript.0.a', state: { ts: 1690000000000, val: 1 } },
    { id: 'javascript.0.b', state: { ts: 1690000000000, val: 2 } },
], result => console.log(JSON.stringify(result)));
rules: true applies rounding and threshold/zero filters (value validity, also useful for
imports); debounce time/block time/minimum change are always ignored, since these are
designed for live state changes and don't make sense for backdated bulk imports. Doesn't
require the datapoint to currently be enabled for live history. On partial failure, the
response is {error, errors: [...], successCount}, on full success {success: true, successCount}.
deleteAll
Deletes a datapoint's entire history stored in VictoriaMetrics:
sendTo('victoriametrics.0', 'deleteAll', { id: 'javascript.0.exampleValue' },
    result => console.log(JSON.stringify(result)));

// also as an array of multiple ids:
sendTo('victoriametrics.0', 'deleteAll', [
    { id: 'javascript.0.a' },
    { id: 'javascript.0.b' },
], result => console.log(JSON.stringify(result)));
Deliberately not implemented: delete/deleteRange/update (single-point
deletion/editing, as offered by the influxdb Admin UI when clicking a chart point).
VictoriaMetrics technically cannot delete or edit individual datapoints – only whole time
series via label match, since storage is based on immutable, time-sorted blocks (like
Prometheus). "Deleting a single point" would in reality delete the entire time series – that
would be surprising and dangerous, so it's deliberately left out.
Retention
VictoriaMetrics' retention is a server-side start flag (-retentionPeriod) of the VM
process itself, not changeable at runtime via HTTP API (unlike e.g. InfluxDB, where the
adapter can actively set a value via ALTER RETENTION POLICY). This adapter therefore only
displays the currently configured retention read-only – to change it, VM must be restarted
with a different -retentionPeriod value (with Docker: change the --retentionPeriod=...
parameter in docker run/docker-compose.yml and recreate the container).
The current retention is visible in three places (all read-only, read once from the
/flags endpoint on adapter start):
- Datapoint
<instance>.info.retention(string, e.g."100y") – for scripts/vis - Log entry on start (
VictoriaMetrics reachable at ... (Retention: 100y)) - Success message of the "Test connection" button in the "Connection" tab
Details:
- Default retention, if
-retentionPeriodis not set: 1 month (31 days). - Minimum: 24h/1 day. VictoriaMetrics doesn't support "unlimited" retention in the
strict sense, but arbitrarily high values are possible, e.g.
-retentionPeriod=100y. - Data is deleted per month partition, on the first day of each new month – not
immediately once the limit is reached. Maximum disk usage is therefore
retentionPeriod + 1 month. - An existing retention can be extended at any time without losing data. If it is shortened, data outside the new limit is deleted at the next month change.
- Full details: VictoriaMetrics documentation, "Retention" section.
Other known limitations
- No multi-cluster support (vminsert/vmselect) – single-node target only.
- Free, per-datapoint configurable extra labels (beyond
unit) are not implemented.
Development
| Script | Description |
|---|---|
npm run lint | ESLint |
npm run check | Type check (tsc --noEmit) |
npm run test:js | Unit tests |
npm run test:package | Checks package.json/io-package.json |
npm run dev-server | Starts dev-server for a local test run incl. Admin UI |
npm run release | Cuts a release (version bump, changelog/news sync, git tag) via @alcalzone/release-script |
Changelog
0.4.5 (2026-10-02)
- (SeaSpotter) Translated one remaining German error string in
getHistory's invalid-id response (lib/history.js) that the review's log/sendTo/errors.push sweep had missed - it's returned to the caller viasendTo, same category as thedataManagement.jsfix in 0.4.4 - (SeaSpotter) Added full i18n names for the
infochannel and theadminTab(flagged by the official repo review's object-structure check)
0.4.4 (2026-09-11)
- (SeaSpotter) Addressed maintainer review findings: translated all remaining German log/error messages to English, fixed the
cacheobject's German-only name to a full i18n object, replaced the German"zeitreihe"keyword with"timeseries", added code-level validation forwriteInterval/requestTimeoutagainst Node.js' timer maximum - (SeaSpotter) CI: added Node.js 26.x to the test matrix; upgraded
@iobroker/testingto 6.2.1
0.4.3 (2026-08-29)
- (SeaSpotter) Completed
info.retention'scommon.nametranslations to all 11 languages (flagged by the official repo review's object-structure check)
0.4.2 (2026-08-28)
- (SeaSpotter) Fixed official ioBroker repo-checker findings: moved
encryptedNative/protectedNativeto the top level ofio-package.json(were incorrectly nested undercommon), removedcommon.docs(redundant with the English README), fixedinfo.retention's role, bumpedengines.node/admin dependency minimums, added full responsive breakpoints to all admin config fields - (SeaSpotter) Added
CHANGELOG_OLD.md,.github/dependabot.yml, and dependabot auto-merge workflow - (SeaSpotter) Releases now auto-publish to npm via trusted publishing (OIDC) and auto-create the GitHub release when a version tag is pushed
0.4.1 (2026-08-28)
- (SeaSpotter) README is now the canonical English documentation (required for official repo submission); full German documentation moved to
docs/de/victoriametrics.md - (SeaSpotter) GitHub repository renamed to
ioBroker.victoriametrics(capital B) to match convention - (SeaSpotter) Adapter-checker compliance fixes: trimmed unpublished versions from
common.news, removed deprecatedcommon.title, correctedkeywords/common.keywordsper-file rules
Older changelog entries can be found in CHANGELOG_OLD.md.
License
MIT License
Copyright (c) 2026 SeaSpotter seatowage@gmail.com
Permission is hereby granted, free of charge, to any person obtaining a copy of this software and associated documentation files (the "Software"), to deal in the Software without restriction, including without limitation the rights to use, copy, modify, merge, publish, distribute, sublicense, and/or sell copies of the Software, and to permit persons to whom the Software is furnished to do so, subject to the following conditions:
The above copyright notice and this permission notice shall be included in all copies or substantial portions of the Software.
THE SOFTWARE IS PROVIDED "AS IS", WITHOUT WARRANTY OF ANY KIND, EXPRESS OR IMPLIED, INCLUDING BUT NOT LIMITED TO THE WARRANTIES OF MERCHANTABILITY, FITNESS FOR A PARTICULAR PURPOSE AND NONINFRINGEMENT. IN NO EVENT SHALL THE AUTHORS OR COPYRIGHT HOLDERS BE LIABLE FOR ANY CLAIM, DAMAGES OR OTHER LIABILITY, WHETHER IN AN ACTION OF CONTRACT, TORT OR OTHERWISE, ARISING FROM, OUT OF OR IN CONNECTION WITH THE SOFTWARE OR THE USE OR OTHER DEALINGS IN THE SOFTWARE.